A big week for uptime monitoring. Everything below is live now, and there's nothing to set up: your monitors already use it.
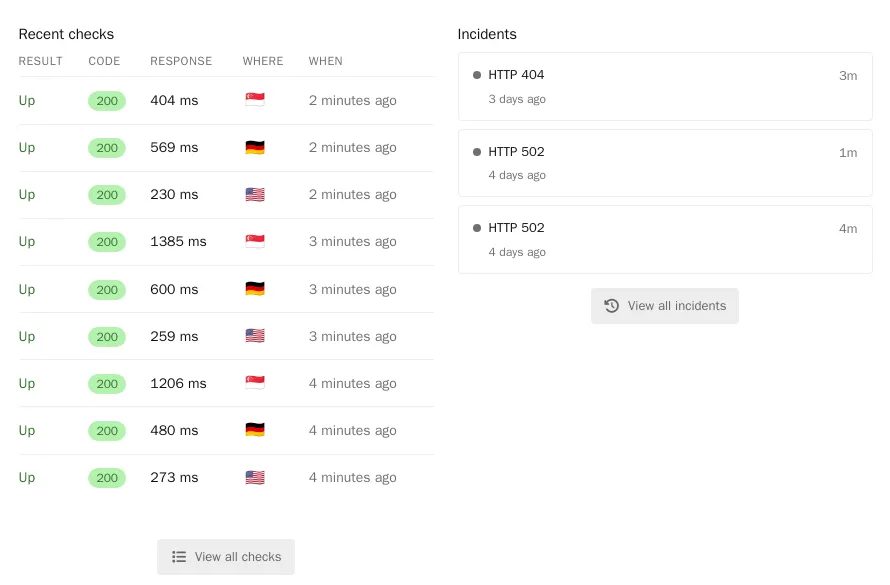
Checks from three regions (Pro). Pro web and TCP monitors are now checked every minute from three places at once: US East (Virginia), Europe (Frankfurt) and Asia-Pacific (Singapore). A site only counts as down when the regions agree. If just one region can't reach your site while the others can, you get a separate "down in that region only" alert instead of an outage, and a note when it recovers. Free monitors are checked from US East.
Every failure is confirmed before you hear about it. When a check fails, more locations in the same region re-check it straight away, and the majority decides. Each region has up to five locations, from Ohio and Oregon to London, Paris, Tokyo, Seoul and Sydney. This applies to every monitor, free or Pro, so a blip at one location no longer turns into an alert.
A daily security check, in one place. Every website monitor now gets a daily look at its publicly visible settings, all in one Security area: website security (HTTPS, security headers, the TLS setup, known vulnerabilities for software the site shows), email delivery (SPF, DKIM and DMARC), and for Flarum forums, checks that the forum's application files aren't public and debug mode is off. Every check is listed, including the ones that pass. Everyone sees the grade and every row. Pro opens each row to show what was seen and how to fix it. It reads only what any visitor can see, so a good grade is a good sign, not a guarantee.
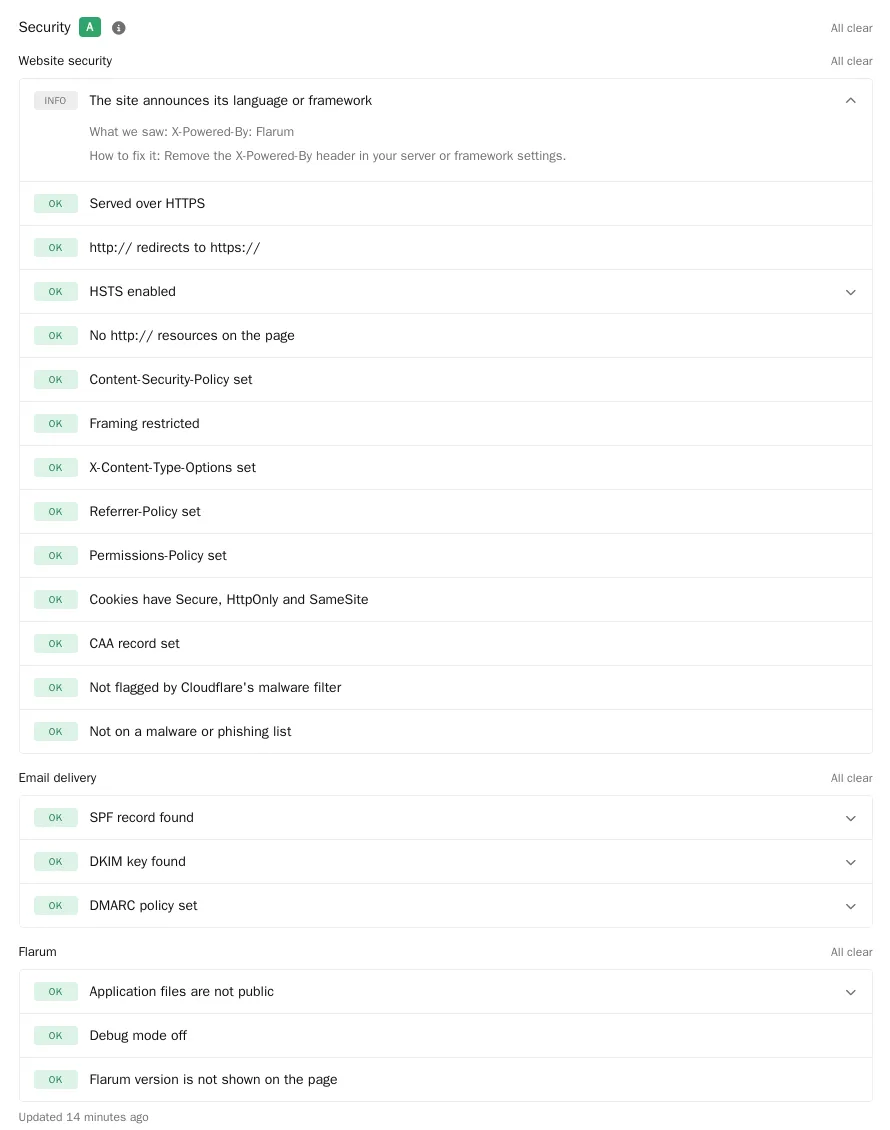
Flarum forums get the full check. Forums used to skip some of these checks because the Flarum panel covered them. They now get the same full set as any site, so a forum's grade may change the first time it's scanned. The Flarum panel keeps what is specific to forums, like the API's health.
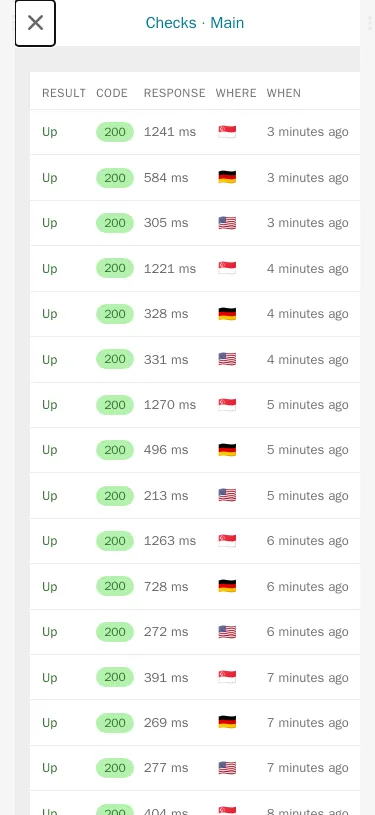
See where each check ran. Every check in a monitor's history shows a flag for where it ran. Hover over it, or tap it on your phone, for the city.
Port checks on every plan. TCP port monitors are no longer Pro-only. The one exception is port 25, which can't be checked from our network; to watch a mail server, use port 465 or 587.
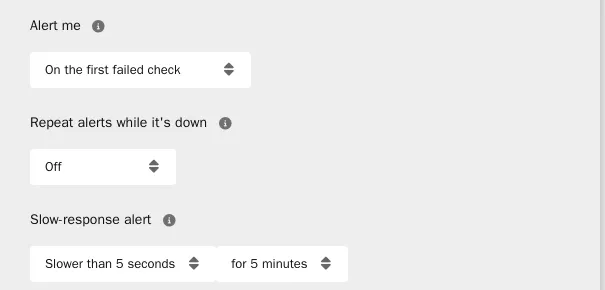
Repeat alerts you can set (Pro). While a monitor stays down, Pro can send the alert again on a schedule you choose, from every 30 minutes to once a day. It's in the monitor form under "Repeat alerts while it's down".
Timeouts count as failures. A site that stops answering is now treated as down, after the same re-checks as any other failure. Before, a site that went silent could look up.
Long-dead monitors are paused. A monitor that has been down for 30 days is paused automatically. Pro accounts get an email 9 days before it happens. Resume it any time from the monitor page.
A faster, tidier dashboard. The monitors page loads in well under a second. Explanations moved behind small ⓘ icons, Change Detection got its own clear heading, and the Security panel uses the same layout as the rest of the page.
Removed. Escalation contacts are folded into repeat alerts, which cover the same need more simply. Team members and the security panel's version reports are gone too. If you relied on any of these, open a ticket from Support and I'll help you set things up another way.
The wiki is updated to match. Questions or anything that looks off: open a ticket from Support.